Background
Before we address the change from components to files, it is important we understand what components are and why did we choose to analyze components in the 1st version of Embold.
In object-oriented programming, Class is the most important building block. It is the blueprint for creating data structures and implementations of member functions or methods. The design of code is dependent on how classes interact with each other.
In the first version of Embold, we called classes, interfaces and structures as components which basically is just a container. In this article, class and component will be used interchangeably.
Though component-based analysis worked well with object-oriented languages, it started showing some flaws when we introduced support for C and for scripting languages like JavaScript and Python. In these scripting languages developers started using files more than classes whereas, in languages like C, classes were mostly used only as placeholder eg. Structures.
To handle these cases, we introduced a virtual component that acted as a container to which all File-level variables or methods are attached. But as we added support for more languages, it became more and more apparent that we needed to change the way we represented the analysis.
Analysis of files instead of components
In the new version of Embold, we perform the analysis on files rather than components. There are also some changes in how the analysis is represented on the UI.
Embold Rating
Earlier all Ratings (Overall, Design, Metrics, Code Issues, Duplication) were calculated at a component level. Despite the fact that issues and duplication are physical attributes, they had been tagged to components through a complex calculation.
In the new version of Embold, components have only Design and Metrics ratings whereas files have all 5 ratings. Design or Metric rating for a file is calculated on a pro-rata basis (based on LOC) if that file contains a part of component(s).
Code Issues and Duplication
With this change in analysis, we tag issues and duplication to file instead of component. Rating for a file is based on a number of duplications & number of code issues present in that file.
So, you will see a difference in duplication percentage if you compare analyses done on old and new versions of Embold. e.g.
LOC of file = 200
LOC of component in that file = 100
Number of duplicated lines in that component = 10
Duplication with component-based analysis=10%
Duplication in file-based analysis = 5%
Antipatterns
In the new version of Embold, the occurrences of antipatterns where class-level dependencies occur and if the class is accessing File-level variables/functions has reduced considerably. Take the example of feature envy.
Feature Envy depends on how many member variables of a component are accessed directly from a particular function. File-level global level variables should be accessed directly and are not termed as accessing class-level member variables directly. However, as it was treated as a Component and its members were Global Functions/Variables, such variables were used to calculate Feature Envy Antipattern. With the new approach, such variables won’t be treated as member variables and so the number of Feature Envy antipatterns reported will reduce.
Metrics and Files
Before this change, the UI had a components page and that was the entry point. But it was hard to see data at the File level. Clicking on any component, you would be redirected to the code view page, where it would show the files containing that component. The metrics and Anti Patterns on the top row were related to the Component.

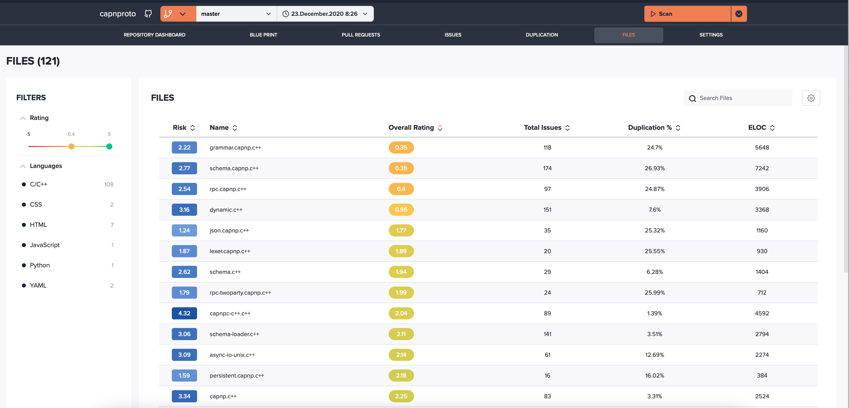
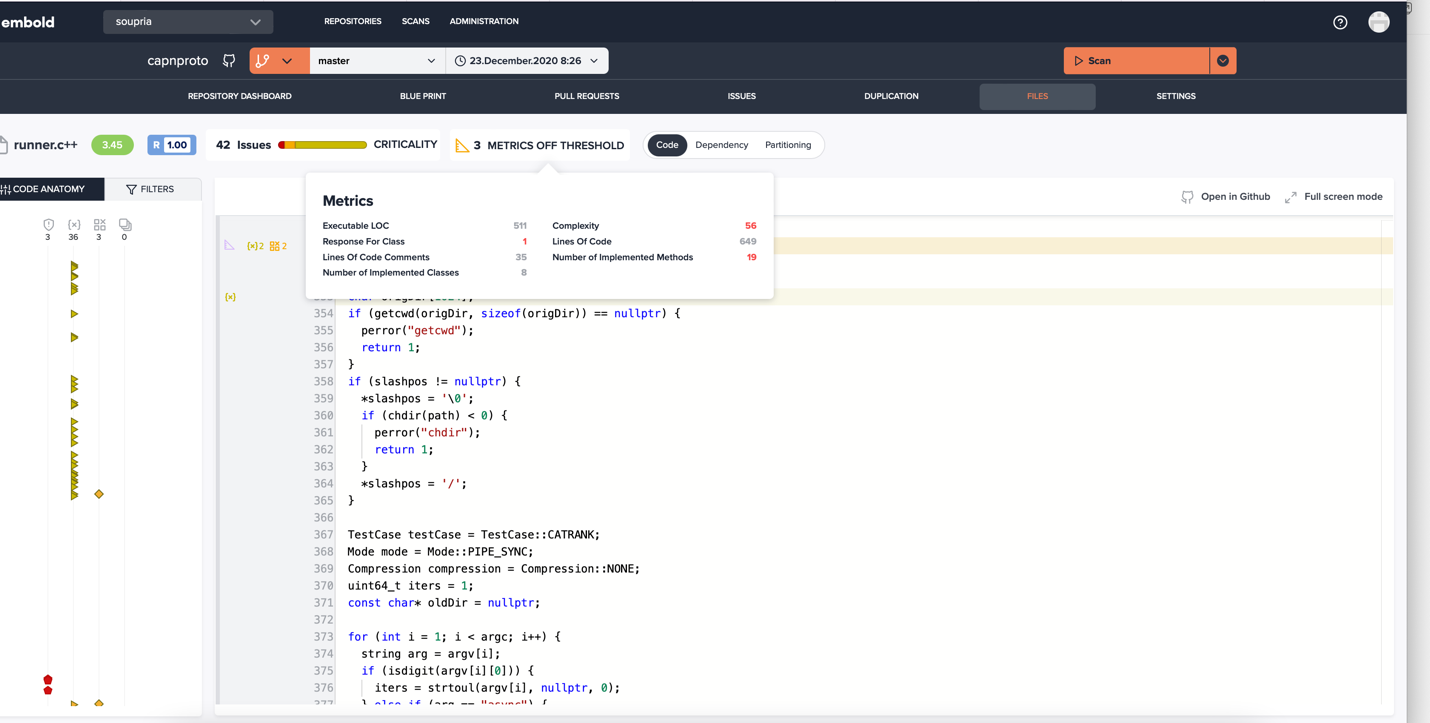
Now with this change, we will see Files listed instead of components and clicking on any file, you will be redirected to the code view of that file. The metrics and anti-patterns will be at the file level. But if you go to the component inside the file, you will still be able to see component level metrics. That data is not lost.
Metrics are now calculated at component level as well as at file level.

We have introduced 3 new metrics for Files
- Number of Implemented Methods
- Number of Implemented Classes
- Number of Global Variables
Old scans (snapshots)
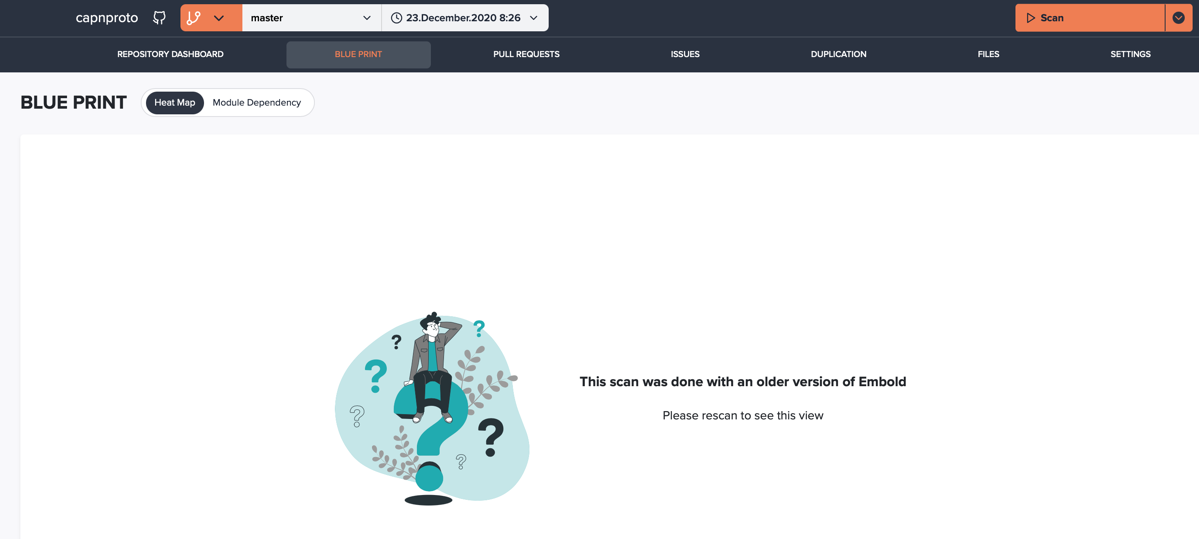
All the analysis data for older snapshots was tagged to components and now they are tagged to files. Hence, we will not show data for older scans on the files page and heatmap page. We urge you to scan the repository again to see the analysis.
You will see the page below for older snapshots. Please rescan the code to see the heatmap.

What Next?
We are still making improvements in File-level representation and analysis data. We are in the process of adding more file-level Anti Patterns and metrics. We will also be adding a new metrics page where you will be able to configure metric thresholds. So stay tuned!


Comments are closed.